Benchmark apps for Android Devices – So you got a shiny new Android phone/tablet and want to check what’s making it hum? Or you wanted to squeeze more power from your existing gear, bumped up the CPU speed, installed a new ROM or updated to the newest Android version, and now need to compare the increase in productivity?
Either those, or just your annoying friends are throwing around benchmarks as bragging rights, so you finally decided to give it a try, and measure the performance of your phone or tablet more scientifically then “yep, no lag”.
For when the geek in you starts to speak, Android Market is brimful of benchmarking apps that measure the CPU, GPU and I/O performance of your handset, even the rendering prowess of your browser. In general, the better the overall scores, the more seamless everyday performance will be, so it’s worth checking what’s out there in terms of benchmark apps.
The results, of course, depend on a number of variables, like the extent of UI overlay and bloatware that came with your phone, the optimization done to the hardware and software from the manufacturer, the moon phases, and other issues you have no control of, but in general benchmarking is a pretty useful tool for comparing performance.
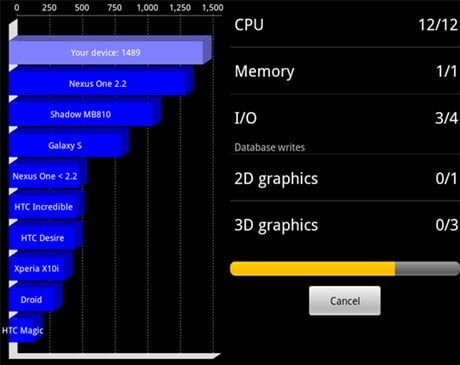
Some argue that it is not the most comprehensive or the most precise, but Quadrant is certainly the most popular benchmarking test for Android devices.With today’s update to version 2.0, it added the long-awaited multicore and Android ICS support, making it an almost universal benchmarking tool across the Android universe.
You come for the bunny that is the mascot of this benchmarking tool, and leave away impressed by how comprehensive it is – CPU, GPU, I/O, even memory card performance can be measured with AnTuTu.It is optimized for multicore processors, and can deliver results in separate categories, or as one total mark that you can compare against the database of other handsets that has built over time.
Another comprehensive performance measurement app for your Android device, which also breaks down the results in categories, and can benchmark the overall score against a database of devices.Takes into account multicore processors, and developers say they have prepped the app for the quad-core onslaught.
From the developer that brought you the Chainfire3D graphics optimization tool, CF-Bench measures performance of all your subsystems, as well as things like JavaScript execution, and works with both native and managed code.Not that popular, but pretty thorough benchmarking app, which includes support for multicore chipsets.
Moving over to strictly graphics performance, the freshly-squeezed GLBenchmark 2.5 is probably the most comprehensive way to measure your GPU prowess, but you have to contact the developer to get it. A lot of manufacturers pair state-of-the-art multicore CPUs with last year’s GPU generation, and it shows in such benchmarks.GLBenchmark 2.5 tests the OpenGL 2.0 ES performance in game-like setups, and runs your GPU through several different scenarios that examine its rendering capabilities. The latest 2.5 versions is in sync with the 1080p times we live in.
NenaMark2 also runs your GPU through its paces, measuring different types of graphics performance scenarios, and returns a very useful for comparison purpose frames per second score, which immediately allows you to compare between different handsets or tablets.
Next come the CPU benchmarks, and Linpack is used for measuring the performance of pretty powerful computers, like the IBM one that beat the world’s chess champion, and it is available for your Android device as well. The results are given in MFLOPS units for easy comparison across devices, including a brawl with iOS ones.
This one does what is says on the label, measures the Pi mathematical constant, thus the calculation algorithm is kept uniform across device, allowing you to measure how powerful your CPU’s integer skills are. Some of the overall system tests like SmartBench also do it, but here it only boils down to one variable – the geek one.
Now we’ve come to the browser tests, which are pretty important as more and more people are getting their Internet fix through their mobile devices now, but Android has the advantage of being able to show websites in their full desktop glory, Adobe Flash and all.
Browsermark is platform-agnostic, meaning that its web-based nature allows you to compare the final score not only against other Android devices, but to the iPhone and iPad, or Windows Phone’s browser as well. It measures different variables of your mobile browser performance that affect the overall rendering speeds, and easily shows what an advantage multicore chipsets are for browsing speeds.
While Browsermark employs JavaScript rendering measurements, this aspect is so important that a dedicated benchmark test is worth running. Sunspider is not flashy, but is cross-platform too, and allows you to easily gauge how capable your silicon is when it comes to JavaScript rendering, just press the link in the title to go there. The smaller result here is the better one.


